Search News
Industry Portal
Hot Articles
- How Factories Can Select Air Quality Controls for Dust, Fumes, and VOCsIndustrial air quality control for factories: learn how to select effective solutions for dust, fumes, and VOCs while improving safety, compliance, energy efficiency, and uptime.
- How to Size Industrial Gas Scrubbing Units for Acid Fumes and Variable AirflowsIndustrial gas scrubbing units: learn how to size acid-fume scrubbers for variable airflows, peak loads, chemical demand, pressure drop, and reliable compliance.
- How to Evaluate Industrial Air Quality Control Systems for Dust, Fumes, and VOCsIndustrial air quality control systems: learn how to evaluate dust, fumes, and VOC solutions by capture efficiency, compliance, maintenance, and lifecycle cost.
Popular Tags
Why cleanroom maintenance failures raise contamination
author
Time
Click Count
Even the most advanced cleanroom can fail when routine upkeep slips. For quality control and safety managers, cleanroom maintenance is not just a technical task—it is a frontline defense against particle buildup, airflow imbalance, microbial risk, and costly production loss. Understanding how maintenance failures trigger contamination is essential to protecting compliance, product integrity, and operational stability.
In semiconductor, battery, precision coating, pharmaceutical support, and high-spec manufacturing environments, contamination rarely begins with a dramatic event. More often, it starts with small maintenance gaps: a delayed HEPA integrity check, an overloaded FFU, a drifting dew point sensor, or a cleaning protocol that no longer matches process intensity.
For teams responsible for audit readiness and worker safety, effective cleanroom maintenance connects air cleanliness, pressure control, humidity stability, and equipment reliability into one risk-management system. When even 1 weak link is ignored for 30 to 90 days, contamination can spread faster than most production KPIs reveal.
How Maintenance Failures Turn Controlled Space into a Contamination Source
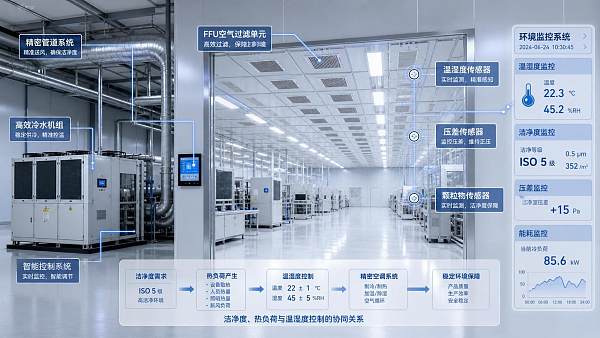
A cleanroom is designed to control particles, microbes, temperature, humidity, and airflow direction within defined limits. In many facilities, those limits are narrow: pressure differentials of 5–15 Pa, temperature bands of 20–24°C, relative humidity of 40%–60%, or lower dew point targets in moisture-sensitive lines.
When cleanroom maintenance falls behind, these limits begin to drift. The problem is not only dirt accumulation. It is the chain reaction between filters, fans, seals, sensors, ducts, drains, and operator procedures. A single fault can compromise ISO classification, process yield, and safety response at the same time.
1. Filter loading raises particle counts
HEPA and ULPA filters do not fail only when torn. They also fail functionally when pressure drop rises beyond acceptable operating range. As filters load with fine dust, airflow volume declines, recovery time lengthens, and laminar patterns become unstable. In high-throughput spaces, this can happen gradually over 6–12 months or much faster if upstream prefilters are neglected.
For quality managers, the warning sign is often not visible dirt. It is a growing gap between designed air changes per hour and actual delivered airflow. Once the room can no longer dilute generated particles quickly, contamination levels rise during gowning, material transfer, and machine operation.
2. Airflow imbalance breaks clean-to-less-clean direction
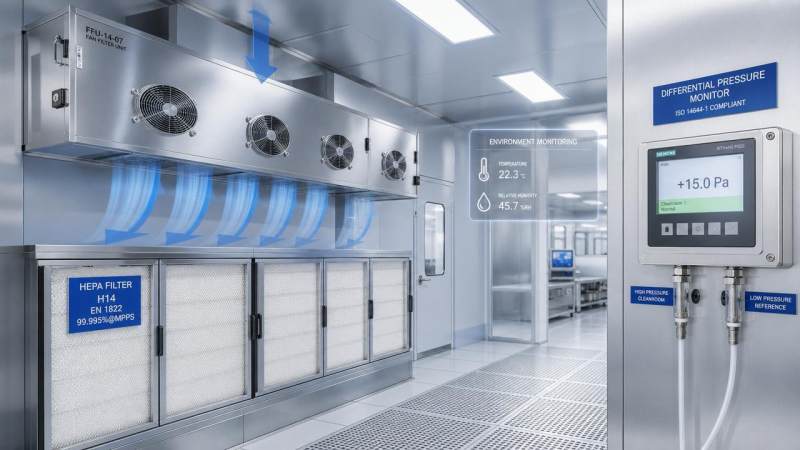
Many contamination events begin with pressure cascade failure. If doors leak, dampers drift, or fan speeds are not recalibrated after maintenance, the room may lose its positive or negative pressure relationship. A 5 Pa deviation may appear minor, but in critical zones it can reverse airflow paths across door gaps, pass-throughs, or utility penetrations.
This matters especially in facilities using FFU grids, CRAC units, and local exhaust together. If these systems are not balanced after filter changes or line modifications, particles and fumes can move unpredictably. Safety managers then face both product contamination and occupational exposure concerns.
3. Moisture and temperature drift create hidden contamination risk
In moisture-sensitive manufacturing, poor cleanroom maintenance can trigger more than airborne particle issues. Desiccant wheels, cooling coils, drain pans, and sensors all influence dew point stability. If a humidity sensor drifts by 3%–5% RH or condensate is not drained correctly, surfaces may support microbial growth or process defects.
In battery, semiconductor, and precision electronics applications, extreme dryness may be required, sometimes below -40°C or even near -60°C dew point in specialized zones. Maintenance failures in drying and recirculation systems can directly affect material quality, electrochemical stability, and corrosion control.
4. Poor cleaning of support equipment reintroduces contaminants
Cleanrooms are not contaminated only by process activity. Return air grilles, ceiling voids, fan housings, duct interiors, lighting seals, and floor-wall junctions can become reservoirs when inspection intervals are too long. If cleaning crews focus only on visible production surfaces, hidden contamination continues circulating through the air system.
This is where many facilities underestimate cleanroom maintenance. A room may pass a visual check yet still show elevated airborne counts because contamination is being generated from worn gaskets, damaged coatings, or neglected plenum spaces.
The table below shows how common maintenance failures translate into contamination mechanisms and practical business impact for controlled environments.
The key point is that contamination is usually systemic, not isolated. Strong cleanroom maintenance programs treat filters, airflow, humidity, and sanitation as connected control variables rather than separate service tasks.
Why Quality and Safety Managers Should Treat Maintenance as a Compliance Control
For decision-makers, contamination is not just a housekeeping issue. It affects deviation rates, investigation workload, line uptime, worker confidence, and customer acceptance. In highly regulated or specification-driven sectors, even one failed environmental check can delay shipment, trigger retesting, or force batch segregation.
Cleanroom maintenance should therefore be managed like any other critical control system: with defined limits, documented frequency, escalation logic, and cross-functional accountability between engineering, QA, EHS, and operations.
Critical indicators that should never be left to reactive maintenance
- Particle count trends by room grade, zone, and shift pattern
- Pressure differential records, especially across doors and airlocks
- FFU motor load, vibration, and airflow uniformity checks every 1–3 months
- HEPA integrity testing at scheduled intervals, often 6–12 months depending on risk
- Temperature and humidity sensor calibration, commonly every 6 months
- Cleaning validation for walls, ceilings, return grilles, and hidden support spaces
When these indicators are trended instead of checked only after alarms, teams can spot contamination precursors earlier. A rising pressure drop or slower room recovery after door opening often provides weeks of warning before a formal nonconformance appears.
The compliance cost of delayed action
Reactive repair may appear cheaper in the short term, but it usually multiplies costs elsewhere. A 2-hour sensor replacement can turn into a 2-day investigation if out-of-spec conditions were recorded without timely response. The total burden may include additional sampling, product hold, CAPA documentation, and schedule disruption across multiple departments.
This is especially relevant where CECS-aligned systems such as precision CRAC units, dense FFU arrays, scrubbers, and controlled ventilation must work in sync. A maintenance gap in one subsystem often shifts load to another, reducing overall environmental control efficiency.
Typical risk escalation path
- Minor drift in airflow, dew point, or pressure goes unnoticed for 7–14 days.
- Local contamination hotspots appear near tools, doors, or return zones.
- Routine monitoring detects an excursion, but root cause is unclear.
- Investigation reveals overdue maintenance, calibration, or cleaning.
- Production loss expands through rework, delay, or preventive shutdown.
For managers, the goal is not only to avoid failure. It is to shorten detection time and reduce uncertainty when abnormal results appear.
Where Cleanroom Maintenance Programs Commonly Break Down
Many facilities have maintenance schedules on paper but still experience contamination events. The gap usually lies in execution discipline, task prioritization, and the quality of environmental data used to guide service intervals.
Overreliance on calendar-based maintenance
A fixed interval such as every 90 or 180 days is useful, but it should not be the only trigger. Process expansion, staffing changes, seasonal humidity swings, and raw material dust load can change room stress significantly. Two lines with the same cleanroom classification may need very different maintenance frequencies.
Weak coordination between facilities and quality teams
Engineering teams may track motor current, pressure drop, and alarm history, while QA tracks environmental monitoring and deviations. If these datasets are reviewed separately, the facility misses pattern recognition. Effective cleanroom maintenance depends on one shared view of room health.
Insufficient attention to hidden contamination sources
Routine wipe-downs are not enough if utility penetrations, sealants, cable entries, or plenum areas are aging. In older facilities, cracked coatings or compressed door seals may create continuous shedding points. These defects rarely trigger alarms, yet they can steadily elevate background counts.
The comparison below helps teams identify whether their current cleanroom maintenance approach is reactive, preventive, or risk-based.
A risk-based or digitally integrated program does not always require major capital investment. In many cases, clearer thresholds, better trend review, and tighter documentation already improve cleanroom maintenance performance significantly.
Practical Maintenance Priorities for FFU, CRAC, Ventilation, and Filtration Systems
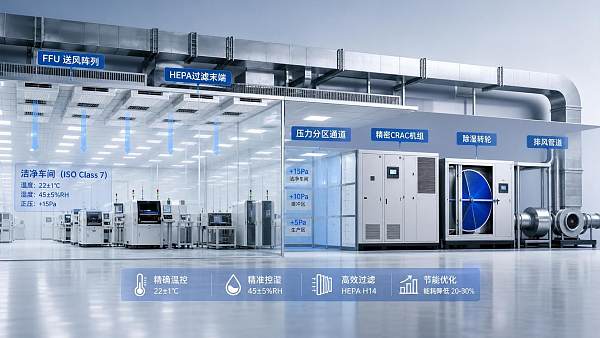
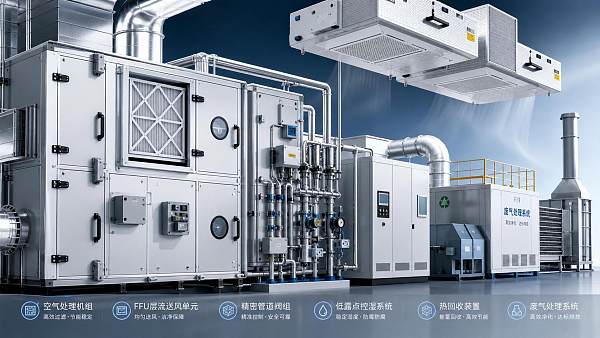
Facilities supported by CECS-related environmental control technologies often rely on multiple systems working at once: FFUs for clean airflow, CRAC units for thermal and humidity control, exhaust and scrubber systems for hazardous byproducts, and ERV or ventilation systems for energy-efficient air exchange. Maintenance planning should reflect this system interdependence.
FFU and terminal filtration
Check fan speed stability, vibration, seal condition, and filter pressure trend. In dense ceiling arrays, even a small number of underperforming units can create local dead zones. A practical inspection cycle is monthly for operating status, quarterly for airflow verification, and scheduled integrity testing based on criticality.
CRAC and humidity control units
Inspect coils, drain pans, desiccant sections, and sensor calibration. If dew point stability is essential, verify response under peak load rather than only under normal conditions. A room that holds target conditions at 50% production may drift badly at 90% occupancy or during seasonal moisture peaks.
Industrial exhaust, scrubbers, and workshop ventilation
These systems affect contamination indirectly by protecting pressure balance and preventing recirculation of process-generated fumes or dust. Fans, dampers, duct leakage points, and neutralization sections should be inspected at defined intervals, often every 1 to 3 months in higher-load operations.
Building envelope and cleanroom finishes
Door closers, panel joints, view windows, floor transitions, and sealants should be part of the maintenance map. Surface integrity matters because worn materials can become particle sources. A quarterly visual survey plus annual detailed condition assessment is a practical baseline for many sites.
A 5-step maintenance control routine
- Define critical rooms and acceptable operating ranges.
- Link each room to equipment, sensors, and service tasks.
- Set alarm limits and action limits separately.
- Trend data weekly and review deviations cross-functionally.
- Update intervals every 3–6 months based on actual room behavior.
This approach helps quality and safety leaders convert cleanroom maintenance from a checklist exercise into a measurable contamination-prevention strategy.
How to Strengthen Procurement and Service Decisions
Many contamination problems are rooted not only in operations but also in procurement choices. Equipment and service contracts that focus only on upfront price often miss lifecycle factors such as filter access, spare part lead time, calibration support, and documentation quality.
What buyers should evaluate before selecting support partners
- Availability of maintenance documentation tied to room criticality
- Defined response times such as 24 hours for advisory support or 48–72 hours for on-site service
- Capability to support FFU, CRAC, filtration, and ventilation as one system
- Clear calibration, test, and reporting procedures aligned with facility compliance needs
- Spare parts planning for filters, belts, seals, sensors, and fan components
For growing manufacturers, the strongest partners are often those who understand both contamination control and energy performance. Cleanroom maintenance should preserve cleanliness without driving unnecessary fan power, over-drying, or unstable thermal loads.
Documentation that reduces future risk
Ask for service records that include measured values, not only pass/fail statements. Pressure drop, airflow readings, sensor offsets, replacement dates, and observed defects create a useful baseline for future troubleshooting. This level of detail improves change control and gives auditors a clearer maintenance narrative.
When environmental systems become more complex, especially in advanced manufacturing and green commercial facilities, intelligence-led maintenance becomes a competitive advantage. That is where a portal and advisory perspective like CECS adds value: connecting micro-filtration, thermodynamic control, emission handling, and energy recovery into decisions that protect both cleanliness and efficiency.
Cleanroom contamination rarely starts with one dramatic breakdown. It grows from missed intervals, drifting sensors, unbalanced airflow, hidden dust reservoirs, and poor coordination between engineering and quality. A disciplined cleanroom maintenance strategy reduces these risks by combining scheduled service, data trending, equipment-specific checks, and stronger procurement standards.
For quality control and safety managers, the priority is clear: maintain environmental stability before deviations reach product, people, or compliance records. If you are reviewing FFU performance, CRAC stability, filtration strategy, ventilation balance, or service planning, now is the right time to tighten your maintenance framework.
Contact us to discuss your cleanroom maintenance priorities, request a tailored environmental control plan, or learn more about practical solutions for contamination prevention, energy efficiency, and long-term operational stability.
Recommended News
 Aug 18, 2026How to Evaluate a High-Tech HVAC Manufacturer for Cleanroom and Precision FacilitiesHigh-tech HVAC manufacturer evaluation guide for cleanrooms and precision facilities. Learn how to assess control stability, compliance, serviceability, and long-term operational risk.
 Aug 13, 2026How to Select VAV Airflow Control Systems for Labs and Cleanroom HVAC ProjectsVAV airflow control systems are critical for labs and cleanroom HVAC projects. Discover how to choose the right system for stability, compliance, and energy savings.
 Jul 21, 2026How to Evaluate Cleanroom Equipment Suppliers in the Middle East for New ProjectsCleanroom equipment Middle East supplier selection starts with technical fit, compliance, service, and lifecycle cost. Discover how to evaluate vendors and reduce project risk.
 Jul 19, 2026How to Estimate HVAC Cost for Electronics Manufacturing Cleanrooms and Production AreasElectronics manufacturing HVAC cost explained: learn how cleanroom class, humidity control, filtration, exhaust, and energy recovery shape realistic budgets and smarter project decisions.
 Jul 14, 2026Electronics Cleanroom Systems in Southeast Asia: How to Choose AHU, FFU, and HEPA LevelsElectronics cleanroom systems Southeast Asia: learn how to choose AHU, FFU, and HEPA levels for better yield, humidity control, energy efficiency, and long-term ROI.
 Jul 13, 2026Cleanroom Design Layout Basics: Zoning, Material Flow, and Contamination ControlCleanroom design layout basics explained: learn zoning, material and personnel flow, and contamination control strategies that reduce risk, improve compliance, and support efficient project planning.
 Jul 12, 2026Air Handling Units Supplier Checklist: 7 Specs to Compare Before You BuyAir handling units supplier checklist: compare 7 critical specs before you buy. Learn how to evaluate airflow, filtration, humidity control, efficiency, and compliance to cut risk and lifetime cost.
 Jul 11, 2026Cleanroom Equipment for Pharmaceutical Plants: What to Specify for GMP ComplianceCleanroom equipment for pharmaceutical plants: learn what to specify for GMP compliance, from airflow and HEPA filtration to pressure, humidity, and cleanability by process.
 Jul 11, 2026EU ETS Revision Reaches Cleanroom AHUsEU ETS revision brings Cleanroom AHUs into focus. Learn how the 2026 amendment affects CE DoC disclosure, carbon cost allocation, EPC tenders, and supplier selection before 2027.
 Jul 10, 2026Cleanroom AHU Cost Guide: Price Ranges, Configuration Factors, and Budget PlanningCleanroom AHU cost explained with realistic price ranges, key configuration factors, and budget tips to compare quotes, avoid hidden costs, and plan smarter cleanroom investments.
 Jul 09, 2026How to Select Precision Air Conditioning for Cleanrooms by Temperature, RH, and Particle RiskPrecision air conditioning for cleanrooms: learn how to choose the right system by temperature stability, RH control, and particle risk to protect yield, ensure compliance, and cut lifecycle cost.
![]() Jul 07, 2026How to Select Heat Recovery Ventilation Systems for Cleanrooms by Class and Air Change RateHeat recovery ventilation systems for cleanrooms: learn how to choose by ISO class, air change rate, leakage risk, and energy performance for safer, more efficient cleanroom operation.
Jul 07, 2026How to Select Heat Recovery Ventilation Systems for Cleanrooms by Class and Air Change RateHeat recovery ventilation systems for cleanrooms: learn how to choose by ISO class, air change rate, leakage risk, and energy performance for safer, more efficient cleanroom operation. Jul 06, 2026Semiconductor Clean Air Systems for Wafer Fabs: Key Design Factors for Yield ControlSemiconductor clean air systems for wafer fabs directly affect yield. Explore key design factors in airflow, AMC, humidity, and pressure control to improve fab stability.
 Jul 04, 2026When to Use Cleanroom Design Services: Scope, Deliverables, and Project Handover TipsCleanroom design services: learn when to engage specialists, what deliverables to request, and how smart handover planning reduces risk, protects compliance, and avoids costly rework.
 Jul 02, 2026How HVAC Humidity Stability Affects Yield in Semiconductor ManufacturingSemiconductor manufacturing HVAC humidity stability directly affects yield, ESD risk, contamination control, and uptime. Learn how stable humidity reduces defects and protects fab performance.
 Jul 02, 2026EN 1886:2026 Sets New EU Entry Bar for Cleanroom AHUsEN 1886:2026 raises the EU entry bar for cleanroom AHUs with new CE marking rules on micro-leakage and heat recovery. Learn what exporters, manufacturers, and buyers must do before 2027.
 Jul 01, 2026SEMI Semiconductor Cleanroom Solutions: What to Compare Before Planning a New FabSEMI semiconductor cleanroom solutions compared the right way: evaluate airflow, humidity, filtration, energy, and scalability before planning a new fab to protect yield and avoid costly redesign.
 Jun 30, 2026What a Clean Environment Control Systems Manufacturer Should Provide Beyond Basic HVACClean environment control systems manufacturer selection should go beyond HVAC. Learn how the right partner improves cleanliness, dew point control, compliance, and energy savings.
 Jun 29, 2026What Drives Cleanroom Temperature Control Cost in New Facility Projects?Cleanroom temperature control cost depends on ISO class, humidity precision, heat load, airflow, redundancy, and lifecycle energy use. Learn what truly drives budgets in new facility projects.
 Jun 27, 2026Electronics Cleanroom Systems Cost Breakdown: What Drives CapEx and Operating Expense?Electronics cleanroom systems cost more than equipment alone. Discover what drives CapEx and operating expense, from FFUs and humidity control to compliance, energy use, and lifecycle risk.
 Jun 25, 2026Clean Environment Control Systems vs Traditional HVAC: Which Fits Sensitive Production?Clean environment control systems vs traditional HVAC: discover which solution better protects sensitive production, improves compliance, and reduces costly contamination risk.
 Jun 25, 2026Electronics Cleanroom Solutions: How to Choose FFU, AHU, and HEPA SetupsElectronics cleanroom solutions explained: learn how to choose FFU, AHU, and HEPA setups to improve yield, control airflow, and reduce lifecycle costs.
 Jun 24, 2026Cleanroom Airflow Control vs Pressure Control: What Matters More for Contamination Risk?Cleanroom airflow control vs pressure control: discover which factor has the bigger impact on contamination risk, product protection, compliance, and cleanroom performance.
 Jun 23, 2026How to Set Cleanroom Temperature Regulation for Stable Processes and Product QualityCleanroom temperature regulation starts with process needs, not generic setpoints. Learn how to control temperature, humidity, airflow, and deviations for stable quality and higher yield.