In advanced manufacturing, cleanroom airflow is not just an HVAC setting—it is a direct variable in defect control, yield stability, and compliance risk.
For technical evaluators comparing FFU layouts, laminar flow strategies, pressure cascades, and filtration grades, small design choices can determine contamination outcomes.
This article examines how airflow direction, velocity uniformity, air change rates, and contamination pathways influence defect rates in high-performance controlled environments.
The core issue: airflow determines where contamination goes
Most cleanroom defects are not caused by particles existing somewhere in the room. They occur when particles reach a sensitive surface.
That distinction matters because cleanroom airflow is the mechanism that either removes contaminants or transports them toward wafers, coatings, optics, cells, or assemblies.
For technical evaluators, the most important question is not whether the room has enough filtration capacity on paper.
The better question is whether the actual airflow pattern moves contamination away from critical process zones under real operating conditions.
A cleanroom can meet nominal air change targets while still creating stagnant pockets, turbulent eddies, or return paths that increase defect probability.
Defect rates rise when airflow carries particles across operators, tooling, material carts, exhaust openings, or thermal plumes before reaching exposed products.
Therefore, airflow design should be evaluated as a contamination transport system, not only as a temperature, pressure, or cleanliness specification.
Why laminar flow is valuable, but not automatically safe
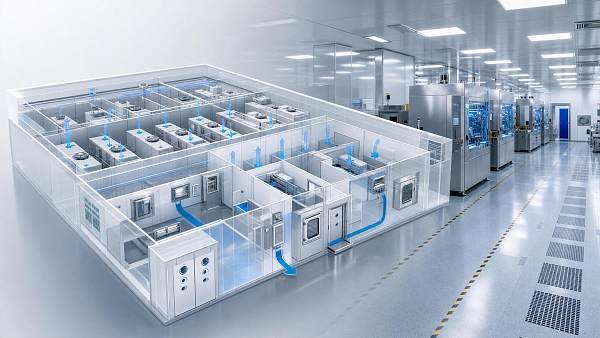
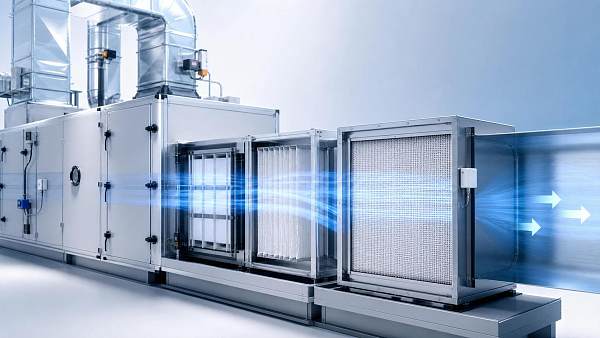
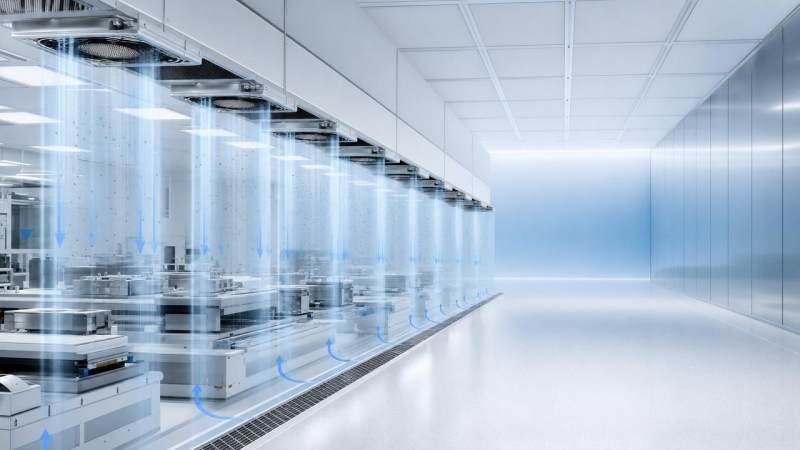
Unidirectional or laminar airflow is widely used because it creates a predictable sweeping effect from clean supply to lower return zones.
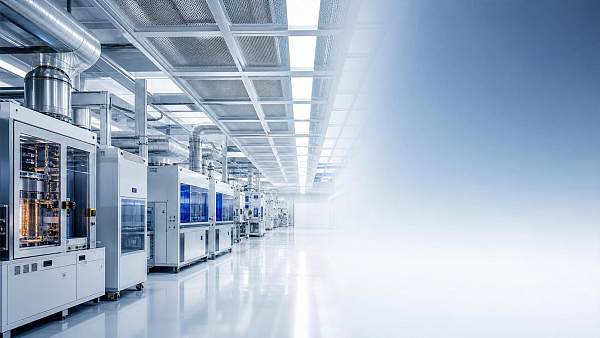
In semiconductor fabs, battery coating rooms, pharmaceutical filling areas, and precision assembly zones, this directionality reduces random particle residence time.
However, laminar flow only protects products when velocity, direction, and obstruction control remain consistent across the critical area.
If airflow strikes equipment surfaces, tool frames, light fixtures, or operator bodies, it can break into turbulence and recirculate particles.
This is why ceiling FFU coverage alone does not guarantee low defect rates. The product-level flow field is the decisive layer.
Technical evaluators should examine smoke studies, computational fluid dynamics results, and in-process particle mapping around the actual production configuration.
The goal is not simply a textbook vertical stream. The goal is stable, clean displacement through the zones where defects originate.
Velocity uniformity often matters more than maximum airflow
Increasing fan speed can look attractive when defect data suggests airborne contamination, but higher airflow is not always cleaner airflow.
Excess velocity may disturb settled particles, increase operator shedding, disrupt precision weighing, or affect coating and drying stability.
At the same time, insufficient velocity allows particles to linger, settle, or drift laterally into sensitive process zones.
The practical target is uniform velocity within a validated range, especially across work surfaces, minienvironments, and tool loading interfaces.
Uneven FFU performance can create local high-speed jets beside low-flow zones, producing cross-contamination paths that are difficult to detect visually.
Filter loading, fan degradation, ceiling leakage, damper imbalance, and maintenance variations can all reduce airflow uniformity over time.
For this reason, velocity mapping should be part of commissioning and periodic verification, not only an acceptance test after installation.
Air change rate is useful, but it can mislead evaluations
Air change rate is one of the most familiar cleanroom airflow indicators, and it remains useful for comparing general dilution capacity.
Yet defect control is rarely determined by room-average dilution alone, especially in facilities with dense equipment or localized contamination sources.
A high air change rate can coexist with contamination trapped behind process tools, under benches, or near personnel movement corridors.
Conversely, a room with moderate air changes may perform well if critical zones have strong unidirectional protection and effective local exhaust.
Technical evaluators should treat air change rate as a starting point, then verify whether particle removal occurs at the defect-sensitive location.
This is especially important in cleanrooms where process equipment generates heat, exhaust demand, chemical vapors, or micro-particle emissions.
The more localized the defect source, the less reliable room-average airflow metrics become as predictors of real yield performance.
Pressure cascades reduce intrusion, but they do not fix poor flow paths
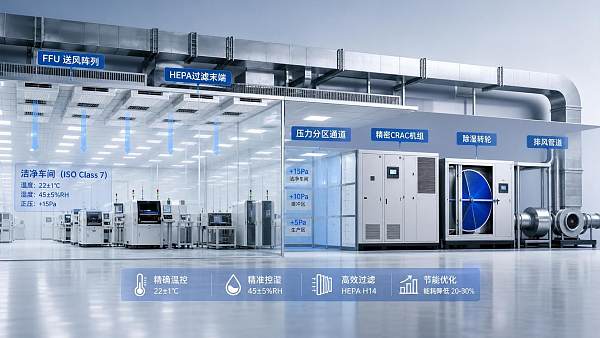
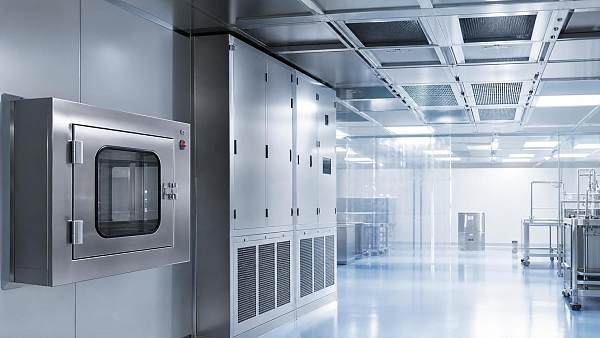
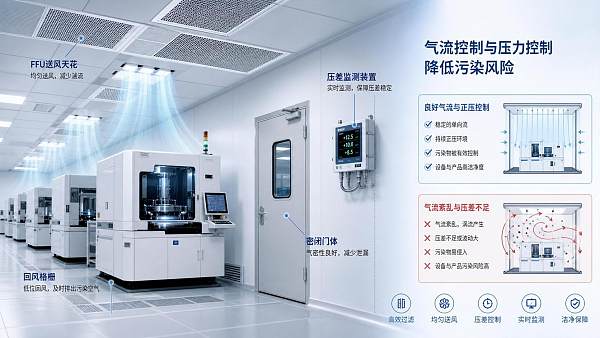
Pressure control is essential for preventing external contamination from entering cleaner zones through doors, pass-throughs, ceilings, or service penetrations.
Positive pressure cascades are especially important where personnel traffic, material transfer, and adjacent support areas create recurring contamination risks.
However, pressure differentials control the direction of leakage, not the cleanliness of the internal airflow path across products.
A room can maintain proper pressure hierarchy while still pushing particles from operators or equipment toward critical surfaces.
This is a common evaluation trap: pressure logs appear stable, yet defect analysis shows contamination associated with specific operations.
Door opening frequency, gowning discipline, transfer cart design, and airlock recovery time should be reviewed together with pressure data.
Pressure strategy is best understood as perimeter defense, while cleanroom airflow pattern is the internal defense against product-level defects.
FFU layout choices directly shape particle transport
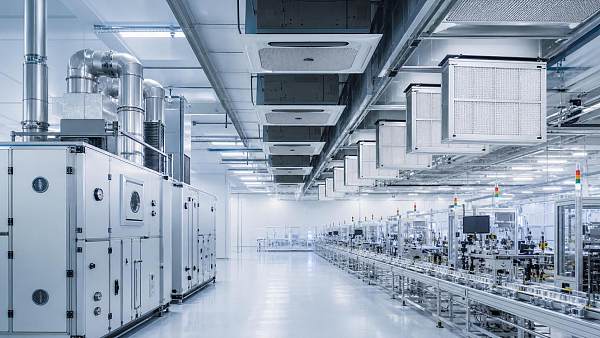
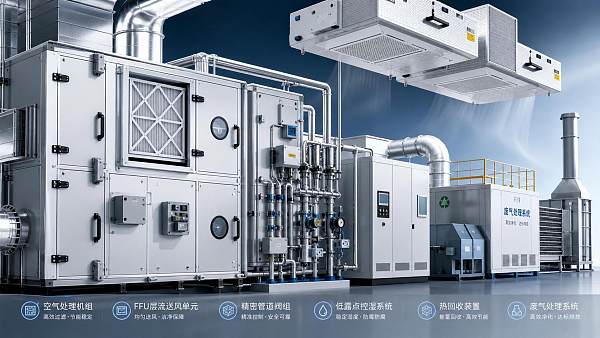
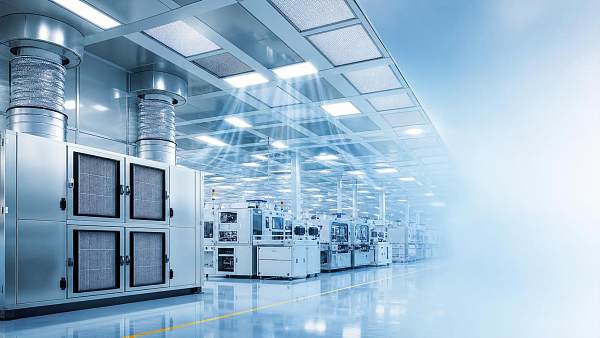
Fan Filter Units act as the distributed lungs of many modern cleanrooms, but their arrangement determines how clean air reaches the process.
Dense FFU arrays can create excellent vertical displacement, yet gaps, inactive zones, and poorly coordinated returns may compromise sensitive tools.
Partial FFU coverage can be cost-effective when clean air is concentrated over process-critical zones rather than unused circulation space.
The risk is that cost-driven reductions may create lateral airflow from dirtier areas toward cleaner areas during actual production movement.
Evaluators should compare FFU coverage with tool layout, process exposure time, operator position, return air placement, and maintenance access requirements.
FFU control strategy also matters. Grouped fan speeds, automatic balancing, and pressure feedback can reduce drift across large cleanroom ceilings.
When defect rates fluctuate by bay, shift, or tool location, FFU performance variation should be investigated before assuming process failure.
Return air placement can decide whether particles leave or recirculate
Supply airflow receives most attention, but return air design often determines whether contamination is removed cleanly or pulled across products.
Low-wall returns, raised-floor returns, and tool-integrated exhaust all create different flow trajectories through the occupied and process zones.
If returns are located incorrectly, clean supply air may sweep contaminants through critical areas before leaving the room.
Obstructed returns can also raise local pressure, distort vertical flow, and create backflow near equipment bases or operator stations.
In high-yield environments, return design should be evaluated with contamination source locations, not only with architectural symmetry.
Smoke visualization remains valuable because it reveals actual particle pathways that drawings and average velocity readings can hide.
A practical rule is simple: contaminants should have the shortest stable route away from products, people, and exposed process interfaces.
Thermal plumes and process heat can break clean airflow
Heat-generating tools, ovens, drives, motors, lighting systems, and operators can all create upward plumes that compete with intended airflow.
These buoyancy effects may lift particles from lower surfaces into product zones, especially where vertical velocities are marginal.
Temperature gradients can also bend airflow, weaken pressure stability, and interfere with coating, lithography, or precision metrology conditions.
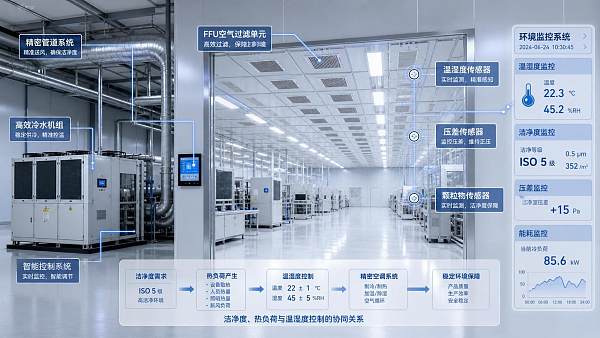
For evaluators, airflow assessment should always include heat load maps and operating states, not only empty-room certification conditions.
A cleanroom that performs well at rest may become unstable when production tools reach full load and personnel density increases.
Localized exhaust, thermal shielding, balanced CRAC control, and proper return placement help prevent heat-driven contamination movement.
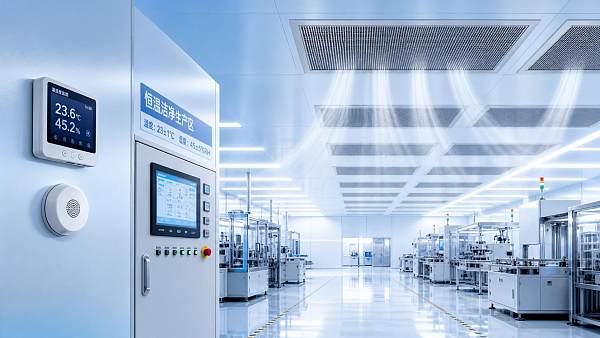
Where humidity or dew point control is critical, airflow and thermal strategy must be integrated rather than optimized separately.
Personnel movement is an airflow disturbance, not just a contamination source
People shed particles, but they also disturb the airflow that would otherwise remove those particles from the process zone.
Walking, reaching, bending, opening doors, and moving carts can create transient vortices that carry contamination into protected areas.
This explains why defect events may correlate with shift changes, maintenance interventions, material replenishment, or inspection activity.
Airflow design should anticipate human behavior by separating traffic routes from exposed product paths wherever possible.
Gowning quality is necessary, but it does not compensate for poor layout that forces operators upstream of critical surfaces.
For high-sensitivity operations, personnel should work downstream or outside minienvironments, with airflow moving from product protection zones toward operators.
Training is more effective when operators understand how their movements disrupt airflow, not only that cleanliness rules must be followed.
How airflow choices appear in defect data
Airflow-related defects often show spatial, temporal, or operational patterns rather than random distribution across all products and tools.
For example, one side of a wafer carrier, coating line, or assembly bench may show recurring particle concentration.
Defects may increase after filter maintenance, ceiling work, tool relocation, fan speed changes, or production ramp-up.
They may also appear during specific door cycles, manual loading steps, cleaning procedures, or temperature recovery periods.
Evaluators should compare defect maps with airflow visualization, particle counter locations, pressure trends, and production event logs.
When defect signatures follow airflow direction or disturbance timing, the root cause is often environmental transport rather than material quality.
This evidence-based approach prevents teams from over-investing in filtration upgrades when the real problem is circulation geometry.
What technical evaluators should verify before approval
A robust cleanroom airflow evaluation should begin with the product exposure map, identifying where particles can actually cause measurable defects.
Next, evaluators should review supply coverage, FFU capacity, velocity uniformity, filter grade, and expected degradation over service life.
Return air location, tool exhaust interaction, pressure cascade logic, and airlock recovery time should be assessed as one system.
Commissioning should include particle testing at rest and in operation, because production conditions reveal risks hidden during static certification.
Smoke studies should cover representative equipment states, operator actions, cart movement, door cycles, and maintenance positions.
Monitoring plans should connect environmental data with defect trends, allowing early detection of airflow drift before yield loss escalates.
The strongest evaluations combine ISO 14644 compliance evidence with process-specific contamination risk analysis and lifecycle maintainability.
Balancing defect reduction, energy use, and compliance
More airflow usually means higher fan energy, greater cooling load, more filter pressure drop, and increased operating cost.
Therefore, the best airflow choice is not the most aggressive design, but the most controlled design for the defect risk.
Variable-speed FFUs, smart pressure control, zoned cleanliness, and localized minienvironments can reduce energy while maintaining product protection.
This is especially important for fabs, battery plants, and precision facilities where cleanroom energy consumption affects lifecycle cost significantly.
Compliance requirements define the minimum acceptable environment, but yield economics often require a more detailed airflow strategy.
Technical evaluators should ask whether each airflow decision reduces a verified contamination pathway or simply increases specification margin.
That discipline helps organizations avoid both under-designed rooms with defect risk and over-designed rooms with unnecessary energy penalties.
Conclusion: clean airflow is controlled contamination routing
Cleanroom airflow affects defect rates because it controls the movement, residence time, and final destination of particles near sensitive products.
Filtration grade, FFU density, air change rate, pressure cascade, and exhaust design are valuable only when they support that goal.
For technical evaluators, the decisive evidence comes from product-level airflow behavior under real production conditions, not only design calculations.
The most reliable cleanrooms combine stable directional flow, uniform velocity, effective returns, controlled disturbances, and continuous verification.
When airflow choices are evaluated as defect-control decisions, teams can improve yield, strengthen compliance, and reduce avoidable operating cost.